The most useful and powerful tool in all of astrophysics is spectral analysis. It can tell us everything relevant we need to know about the object being studied. From the spectrum of any celestial object, we can calculate the temperature, the density, the elements present within it and even information about the magnetic field of such objects. In the most fundamental sense, observational astronomy and astrophysics hinges on spectral analysis since the only way to study far away objects is to study the electromagnetic radiation it emits and the only way to study such radiation is by spectral analysis.
What are spectra and how they are produced
This begs the question: what is a spectrum? In physics, a spectrum is a range of wavelengths emitted by any object that emits electromagnetic radiation. From just the spectrum of an object we can understand the kind of radiation it emits. We can see spectra in everyday life. The most common example is a rainbow in which the 7 constituent colours of visible light are arranged in a specific order depending on how the rainbow was formed. An interesting thing to note here is that colour doesn’t fundamentally exist. It is just our brain’s way of making sense of the different kinds of wavelengths of light that fall on the retina of the eye. Thus, the rainbow is a showcase of the different wavelengths that constitute visible light. Visible light isn’t the only part of the entire electromagnetic spectrum. In reality the visible part of the EM spectrum is a very small part of it. It ranges from gamma rays with wavelengths of the order of a billionth of a metre to radio waves that have wavelengths in the order of 1000 metres.

To understand how spectra are produced we need to first understand how objects emit electromagnetic radiation. Within any object there are many electrons and other fundamental particles that move around and collide with each other causing them to accelerate and decelerate. This acceleration or deceleration is accompanied by emission of electromagnetic radiation. The range of energies of this radiation is continuous and thus the spectrum obtained is a continuous one.
Different kinds of spectra and their applications
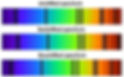
There are 3 kinds of spectra: continuous, emission and absorption spectra. The kind of spectrum explained above is a continuous spectrum where all the constituent wavelengths of the emitted radiation can be seen. Emission spectrum is a kind of spectrum where only lines at specific points on the spectrum are observed. Absorption spectrum is just a continuous spectrum but with dark lines present throughout the range of wavelengths at specific points. The production of these 3 spectra was explained by Gustav Kirchoff as:
A continuous spectrum is created by a hot solid or liquid or a dense enough gas.
Emission spectra are produced by low density hot gases.
A low density cool gas in front of a hotter solid or liquid or a sufficiently dense gas produces an absorption spectrum.
Stars produce both absorption and emission lines. Absorption lines from a star are produced due the fact that stars are very hot at their core but become cooler towards the surface. Emission lines are produced owing to the presence of a very hot, thin plasma on the outer surface of some stars. This plasma is much hotter than the surface of the star.

Study of chemical composition
Emission spectra are a consequence of quantum mechanics. According to established laws, electrons can occupy only specific positions within an atom and each of these positions is representative of some energy. Thus, electrons within an atom have very specific energies associated with them based on what position within the atom they occupy. It is also possible for electrons to move from one energy level to another either by absorption or emission of energy. However since the new energy level is not where they are supposed to be, the electrons return to their original energy level after a few seconds. This is again accompanied by emission of energy in the form of electromagnetic radiation. From Planck’s law it is known that energy is directly proportional to the frequency of radiation. Thus the emitted radiation has a very specific frequency. In other words, this emitted radiation is the fingerprint of the atom. With many different atoms around, we can get a spectrum where there are only specific lines present at specific wavelengths. Thus emission spectra can be used to identify the elements present within celestial objects.
Absorption spectra can also be used to find out the elemental composition of celestial objects. A continuous spectrum is produced by a hot or dense object. However if a cooler less dense object is present in front of it, very specific wavelengths of light are absorbed by the cooler object giving rise to dark “absorption” lines in the spectrum. The absorption of very specific wavelengths is due the same reason as that of the production of emission spectra. Thus, even absorption spectra are characteristic of the elements present within a celestial object. In the case of the Sun, there are many absorption lines seen in its spectrum. These lines are known as Fraunhofer lines in honour of Jacob Fraunhofer who was the first person to study the spectrum of the sun and identify 574 individual dark lines in the spectrum. The lines correspond to various elements such as hydrogen, sodium, calcium and many more.

Measurement of temperature
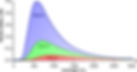
The spectrum of a star can be used to create a spectral profile of the star. A spectral profile is a graph of the intensity of the light received plotted against the wavelength of the light. This graph shows how much light of a certain wavelength was observed by the spectroscope. For a star, the graph is almost bell shaped with sharp dips in between representing the dark lines in the spectrum of the star. The spectral profile can be used to calculate the temperature of a star using a formula known as Wien’s displacement law. This law states that the temperature of an object is inversely proportional to the peak wavelength, i.e., the most intense wavelength of its emitted radiation. Thus, the hotter an object is, the peak of the spectral profile would shift more to the left and be higher in intensity.
Measuring the radial velocity of an object
Apart from the temperature and elemental composition, spectra also allow characterization of the motion of an object relative to us. The speed with which a star or any celestial object is moving away from us or toward us can be measured just by studying the spectrum of the object. A point to note here is that this speed is just part of the entire velocity of the object. The velocity measured using the spectrum is known as the radial velocity, i.e., the velocity of motion in our line of sight. The entire velocity is comprised of radial component and a tangential, i.e., direction at a right angle to our line of sight. An extremely important phenomenon used to measure the radial velocity is the Doppler Effect.
The most common example of the Doppler effect is the changing pitch of the horn of a vehicle that moves past us. In more technical terms, the Doppler effect is the change in the apparent frequency, i.e., the frequency observed by an observer, of a wave due to relative motion between the observer and the source of the wave. This happens because when a source of waves begins moving relative to an observer, the exact distance to the observer where the wave is emitted keeps changing. As a result the wave has to cover a different distance in a different amount of time due to the fact that the speed of the wave remains unchanged. Thus, a change in the frequency and wavelength are observed. When an object moves away from the observer, the wavelength of the wave increases while the wavelength decreases when the source moves towards the observer.
Thus, in case of light (or any EM radiation), the spectrum of an object moving away from us gets shifted towards the red end while it gets shifted to the blue end for an object moving towards us. These phenomena are called redshift and blueshift respectively. The spectrum of the celestial object moving relative to can be compared to a spectrum with well known absorption lines to find out how much the wavelength has changed. This value can then be used in a mathematical formula to find out the radial velocity of the object.
The Doppler effect of the spectrum of stars comes in very handy when studying a binary star system (a star system where two stars of different masses orbit around a common centre of mass). Due to the relative motion between both these stars, their respective spectra also continually change based on their position in the orbit at a particular moment in time. The continuous change in the spectra can be used to calculate the ratio of the masses of the star, get an idea about their orbits and so on.
The radial velocity method is also useful in the detection of exoplanets. If an exoplanet were present, both the star and the planet would orbit around a common centre of mass. Thus, apart from the cosmological redshift (i.e., the redshift in the spectra of objects due to the expansion of the universe), we would also observe a periodic change in the spectrum of the star. Doing the analysis of the spectrum we can find the ratio of the masses of the two orbiting objects and in the end conclude whether the other orbiting object is a planet or not.
Spectral analysis can yield many more results than has been explained in this post. The very basic act of splitting up the light that we receive from something into its constituents might seem a simple thing. But the beauty of this process lies in its potential to give us almost every relevant information about any object in the universe. While many problems may occur while doing the analysis, it is safe to say that spectral analysis remains the most powerful tool in observational astronomy.